Study design
A cross-sectional study was conducted among patients with diabetes attending the outpatient unit of the Endocrinology Department at Farhat Hached University Hospital in Sousse (Tunisia) between November 2023 and May 2024.
Study population
For internal validity studies regarding sample size, it is recommended to use the ratio of the number of subjects (n) to the number of items (p)17. This ratio can vary from three to ten. Other researchers suggest that a range of 200–300 participants is appropriate for factor analysis (19). Given that the HLPCQ scale contains 26 items and assuming a ratio n/p of 10, a minimum of 260 participants was required for the study.
Considering the lack of specific and updated lists of patients with diabetes followed in our outpatient Endocrinology clinic, randomization was not possible. Accordingly, during the study period, participation in the study was suggested for every patient with diabetes who had an appointment for a medical check-up and responded to the inclusion and non-inclusion criteria. The inclusion criteria were:
Non-inclusion criteria were:
Data collection
During the medical check-up appointment in the outpatient clinic, collected data included:
-
-Sociodemographic characteristics.
-
-Anthropometric measurements (weight and height) taken barefoot with light clothing.
-
-Systolic and diastolic blood pressure readings, obtained using a manual sphygmomanometer after a minimum of 15 min rest with the arm supported at heart level.
-
-Biological test results (HbA1C, total cholesterol, LDL, HDL, triglycerides, urea, creatinine and albuminuria), performed two days prior to the consultation.
-
-The latest fundoscopy results.
Subsequently, participants were called by phone within three days after the medical check-up to administer the Arabic version of the HLPCQ scale (annex). This scale assesses the frequency of adopting lifestyle habits. The responses are rated on a four-point scale (1 = Never or rarely, 2 = Sometimes, 3 = Often, 4 = Always). These 26 items are grouped into five subscales:
-
1.
Healthy dietary choices: 7 items, maximum score of 28.
-
2.
Avoidance of harmful food: 4 items, maximum score of 16.
-
3.
Daily time management: 8 items, maximum score of 32.
-
4.
Structured physical activity: 2 items, maximum score of 8.
-
5.
Social and mental balance: 5 items, maximum score of 20.
Evaluation is based on the total score, where a higher score indicates a healthier lifestyle. Each subscale can also be assessed separately13. The maximum overall score is 104.
The translation of the HLPCQ scale into Arabic and back-translation process were conducted following Guillemin’s methodology18. The original version was independently translated into Arabic by two bilingual translators (family medicine residency trainees) who had been informed about the study’s aims. A consensus meeting involving the two translators and the study coordinator (an associate professor of preventive medicine) was held to finalize the Arabic version of each item.
This Arabic version was then independently back-translated into English by two other bilingual translators (two other family medicine residency trainees) without access to the original scale.
A multidisciplinary panel of four bilingual experts (a professor and an associate professor of Occupational Medicine and two associate professors of Preventive Medicine) verified the equivalence between the original and back-translated versions. They also ensured the semantic fidelity and comprehensibility of the translated items.
The Arabic version of the scale was pre-tested among 10 patients with diabetes who met the inclusion criteria, as recommended19. The administration time by phone ranged between 4 and 8 min.
Variables definitions
-
– Overweight was defined by a body mass index (BMI) comprised between 25 and 29.9 kg/m²20.
-
– Obesity was defined by a BMI ≥ 30 kg/m²20.
-
– Poorly controlled diabetes was defined by a Glycated haemoglobin (HbA1C) > 7.5%21.
-
– Total cholesterol level was considered high when > 2 g/L22.
-
– HDL cholesterol level was considered low when < 0.5 g/L in women and < 0.4 g/L in men22.
-
-Diabetic nephropathy was defined by albuminuria ≥ 30 mg/24 h, an albumin-to-creatinine ratio > 30 mg/g, or creatinine clearance < 60 mL/min/1.73 m²23.
-
-Diabetic retinopathy was determined by an annual fundus examination conducted by an ophthalmologist24.
Data analysis
Data entry and analysis were conducted using the SPSS (Statistical Package for Social Sciences) Statistics for Windows, version 18.0 (SPSS Inc., Chicago, Ill., USA). Quantitative variables were described using medians and interquartile ranges (IQR). Qualitative variables were described using frequencies and percentages.
Regarding face validity, the length, item wording, and response options were revised by the four expert members. Additionally, after pre-test, items that were incomprehensible to two participants or more were reformulated by the expert group. A final verification was conducted by the study coordinator to identify and correct any potential translation errors.
To ensure content validity, the content validity ratio (CVR) was calculated for each item. For this purpose, seven experts (three endocrinologists, two epidemiologists and two professors of occupational medicine familiar with research studies on lifestyle) were asked to give a score from 1 to 3 on a scale, where 1 means the item is not necessary, 2 means the item is useful but not essential, and 3 means the item is essential25. The formula to determine CVR is as follows: CVR = (Ne – N/2) / (N/2): where Ne is the number of experts giving a score of 3, and N is the total number of experts. The CVR value ranges from ‒1 to 1. The closer the value to 1, the higher the agreement among experts and the greater the likelihood the items should be included in the instrument. Conversely, the closer the value is to ‒1, the lower the agreement; meaning the items need to be removed or revised25. The minimum CVR value for seven-panel experts involved is 0.9926.
In addition, experts were asked to assess independently the relevance and clarity of each item considering the Tunisian cultural context. A content validation form was used for this purpose. The relevance of each item was rated on a four-point scale (1 = Not relevant; 2 = Somewhat relevant; 3 = Quite relevant; and 4 = Highly relevant). The clarity rating followed the same 1–4 scale. To calculate the Item content validity index (I-CVI) for relevance or clarity, the proportion of experts who gave a rating of either 3 or 4 to an item was divided by the total number of experts25.To measure the Scale level Content Validity Index (S–CVI), the average of all I-CVIs was calculated for relevance and clarity25. Considering that seven experts were involved in assessing content validity, the scale was considered to have excellent content validity when I-CVI is above 0.78 and S-CVI is above 0.9025.
The representativeness of the HLPCQ domains was preserved. No items were added or removed during translation.
The reliability of the questionnaire was assessed using Cronbach’s alpha coefficient, which measures the internal consistency of items. A value greater than 0.70 was considered acceptable27.
For studying construct validity, exploratory factor analysis (EFA) was employed. Before performing EFA, the Kaiser-Meyer-Olkin (KMO) test and Bartlett’s test of sphericity were conducted to assess the suitability of the dataset for factor analysis28. A KMO value greater than 0.80 indicates an intelligible and stable factorial structure; values between 0.60 and 0.80 indicate a moderate structure; and values below 0.60 reflect a poor and unstable structure28.
A statistically significant Bartlett’s test (p < 0.05) indicates that sufficient correlations exist between the variables to continue with the analysis28.
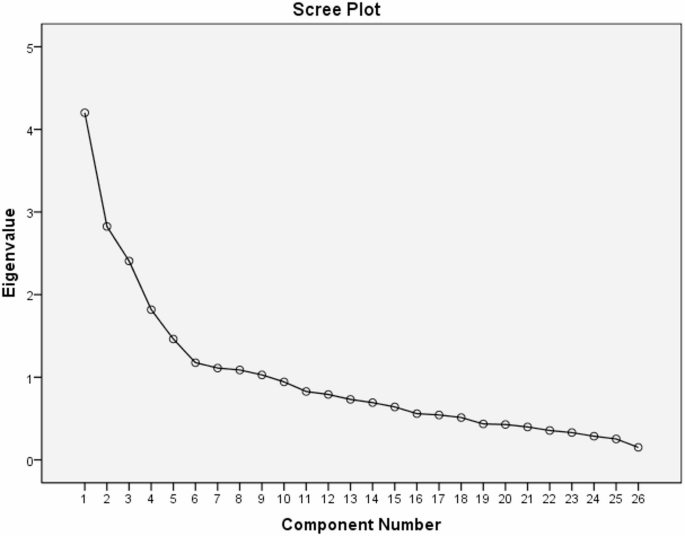
Principal Component Analysis (PCA) was used to extract factors. The number of components was determined using two criteria: eigenvalues and Cattell’s scree plot28.
An eigenvalue greater than 1 was considered indicative of a significant factor29.
To simplify factor interpretation, Varimax orthogonal rotation was applied28. Items were then reorganized according to their loadings on each factor.
The component matrix was used to determine the weight of each item per factor30. Each item was assigned to the factor with which it had the highest correlation. An item was considered to belong to a factor if its loading was ≥ 0.30 in absolute value31.
Once item groupings were finalized, each factor was labeled based on the common theme of its items.
Ethical considerations
The current study was conducted in accordance with the ethical principles of the Declaration of Helsinki. All study procedures complied with relevant institutional and international guidelines and regulations. The research protocol was reviewed and approved by the Research Ethics Committee of University Hospital Farhat Hached. Oral informed consent was obtained from all participants prior to enrollment. Participation was voluntary. No financial compensation was provided. All collected data were handled confidentially.